Support for a wide range of chart types
Body Editor
 Sample
More chart types
Create more premium AI videos with commercial usage and priority processing.
Allow other users to view your generated result.
Hide your prompt and uploaded source files from other users.
Waiting for Results
Complete the required inputs and click Generate.
AI Image Tool
Graph Maker is a powerful data visualization tool that helps you transform raw numbers into clean, professional, and visually engaging charts in seconds. No design experience needed — just a few simple steps to create bar charts, pie charts, line graphs, and more, making trends and insights easy to understand at a glance.
Try Graph Maker NowGraph Maker is built to remove the friction from data visualization. With an intuitive editor and ready-to-use templates, you can turn raw data into polished charts in minutes—no coding, no complex setup, just a smooth and guided creation experience.
Body Editor
Spiderman AI
Can Display
More AI Image Tool
Graph Maker goes beyond basic chart generation. It helps you communicate insights more effectively by transforming data into visuals that are easier to explore, understand, and share across different contexts.
Graph Maker goes beyond basic chart generation. It helps you communicate insights more effectively by transforming data into visuals that are easier to explore, understand, and share across different contexts.
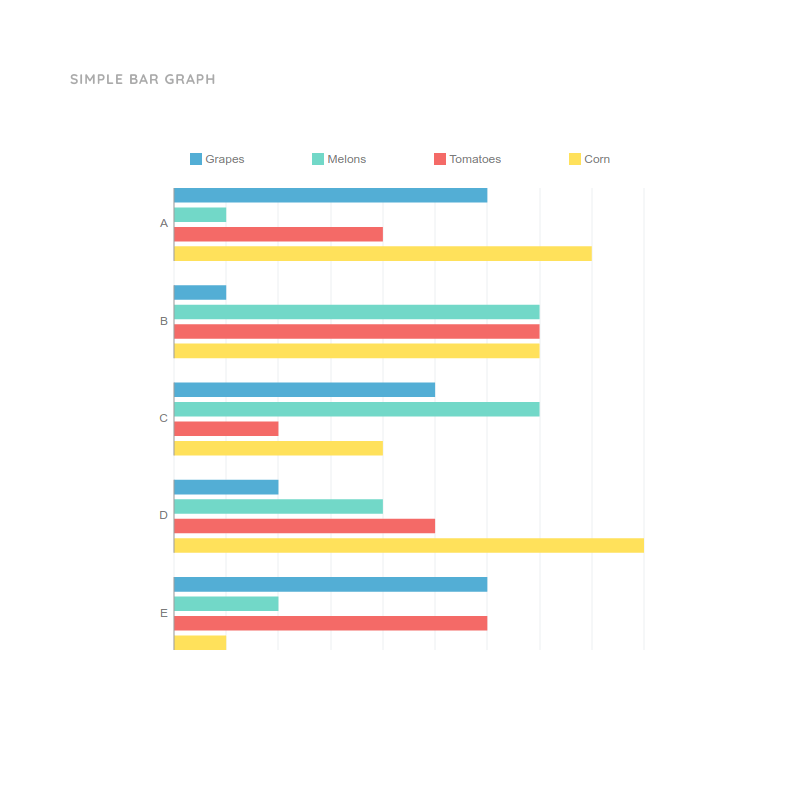
Graph Maker goes beyond basic chart generation. It helps you communicate insights more effectively by transforming data into visuals that are easier to explore, understand, and share across different contexts.

Graph Maker goes beyond basic chart generation. It helps you communicate insights more effectively by transforming data into visuals that are easier to explore, understand, and share across different contexts.
Graph Maker is designed for a wide range of users, making it easy for anyone to turn data into clear, compelling visual charts—no matter their background or experience level.

Use Graph Maker to visualize key metrics, performance data, and reports, making presentations clearer, enhancing team discussions, and supporting faster, data-driven decisions. Ideal for project updates, quarterly reports, and executive dashboards, Graph Maker helps leaders communicate insights with clarity and confidence.
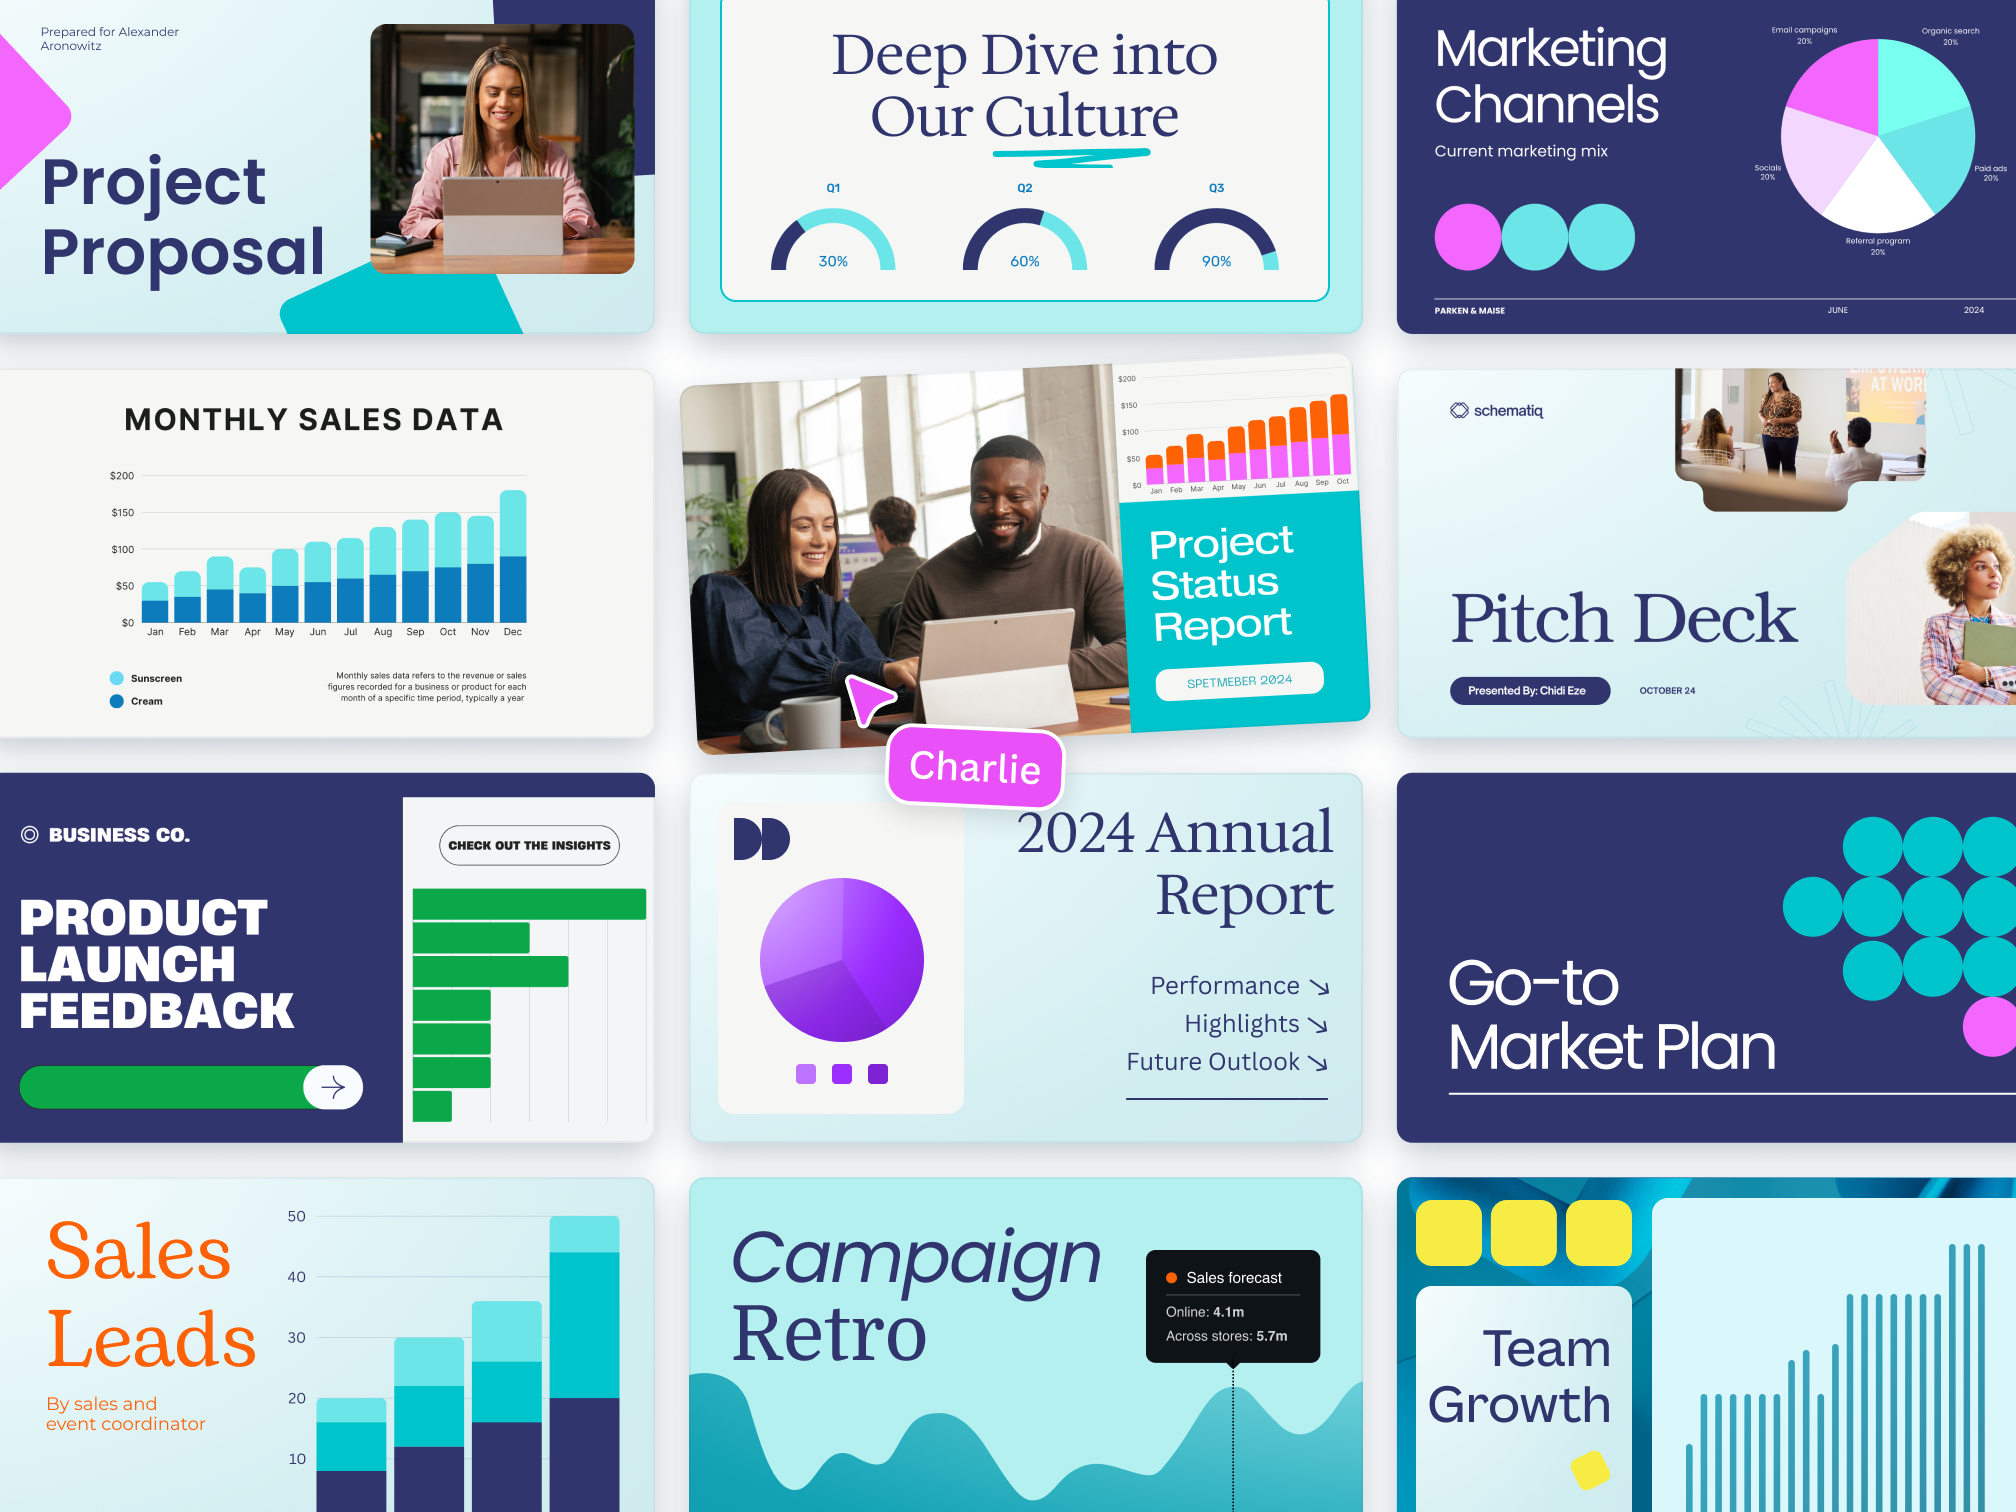
Graph Maker helps transform campaign results, user insights, and growth data into easy-to-understand visuals, enabling teams to share insights seamlessly with stakeholders and optimize strategies. From campaign performance tracking to operational efficiency reports, Graph Maker makes data actionable and presentations more persuasive.

With Graph Maker, research data, learning materials, and experiment results become visual charts that improve clarity and comprehension. Educators can create engaging lesson materials, while students can present findings clearly, making data more understandable and interactive.
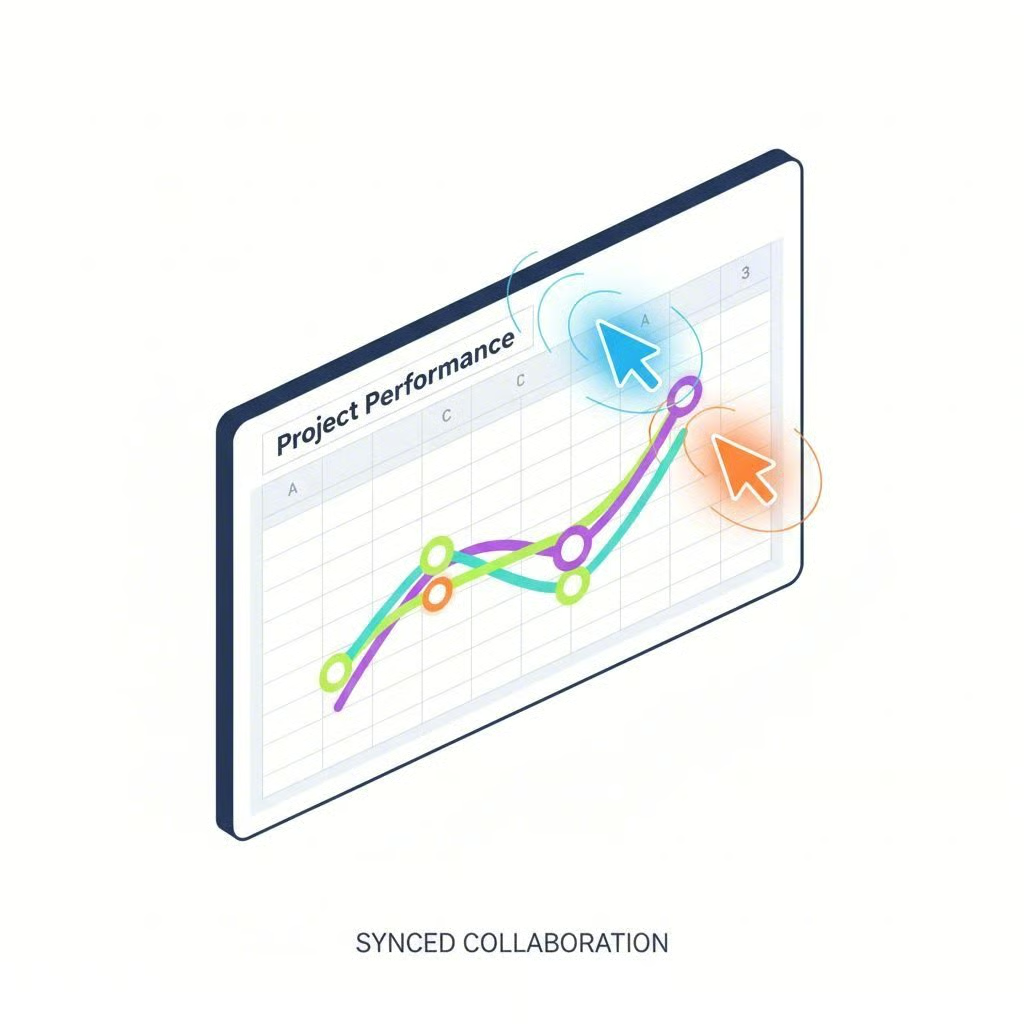
Quickly generate high-quality charts for internal reviews or client presentations, helping insights stand out with clarity and confidence. Graph Maker supports complex datasets, multi-dimensional analysis, and professional reporting, allowing analysts to save time while producing polished, impactful visualizations.
Using Graph Maker on China Video AI gives you a smoother and more efficient chart creation experience. The platform’s powerful support lets you focus on turning data into clear, professional visuals without any friction.

Skip the time-consuming setup and go straight into Graph Maker’s editor to begin creating your charts immediately.

Continue working on your Graph Maker charts across multiple devices with automatic syncing, keeping your data and visuals consistent and uninterrupted.

Apply brand fonts, colors, and styling across all Graph Maker charts so every visual stays professional and perfectly aligned with your brand identity.
China Video AI provides controlled sharing permissions and robust management for your Graph Maker charts, keeping your work safe while accessible to the right team members.
Export Graph Maker charts as PNG, JPG, PDF, or embed them directly into web pages, making your visuals ready for presentations, reports, or online content.
Whether you’re a beginner or a professional, Graph Maker on China Video AI offers clear guidance to make chart creation quick, easy, and enjoyable.
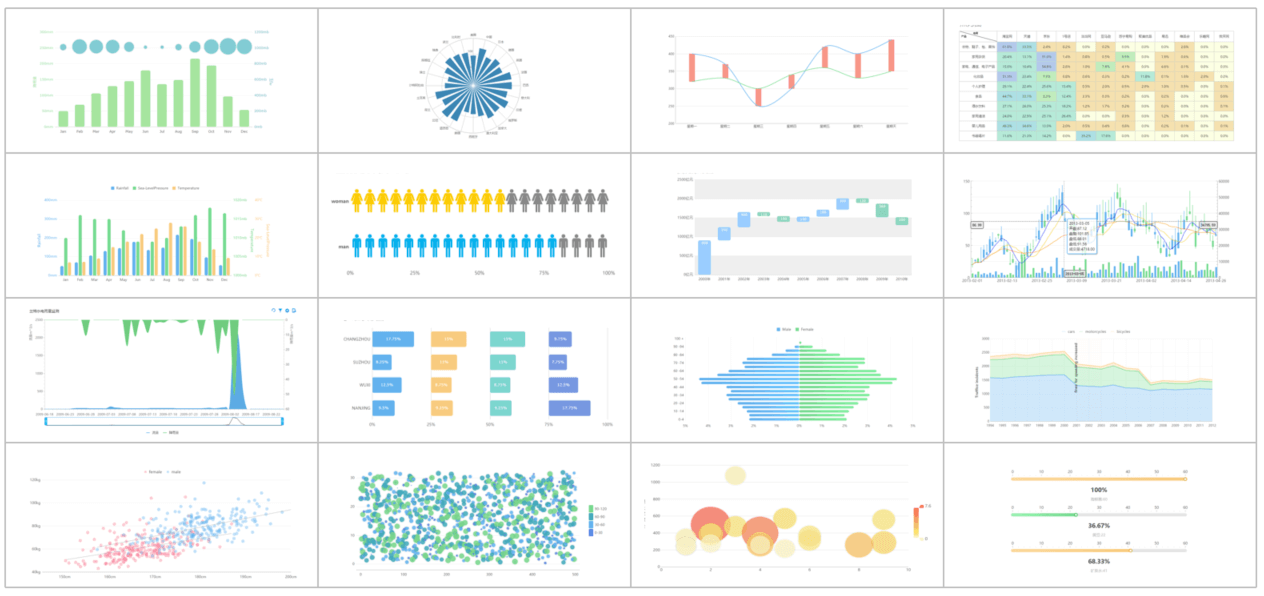
With Graph Maker, you can transform your data into clear, professional, and insightful charts. The following chart types showcase the versatility of Graph Maker and provide inspiration for your data visualization projects:
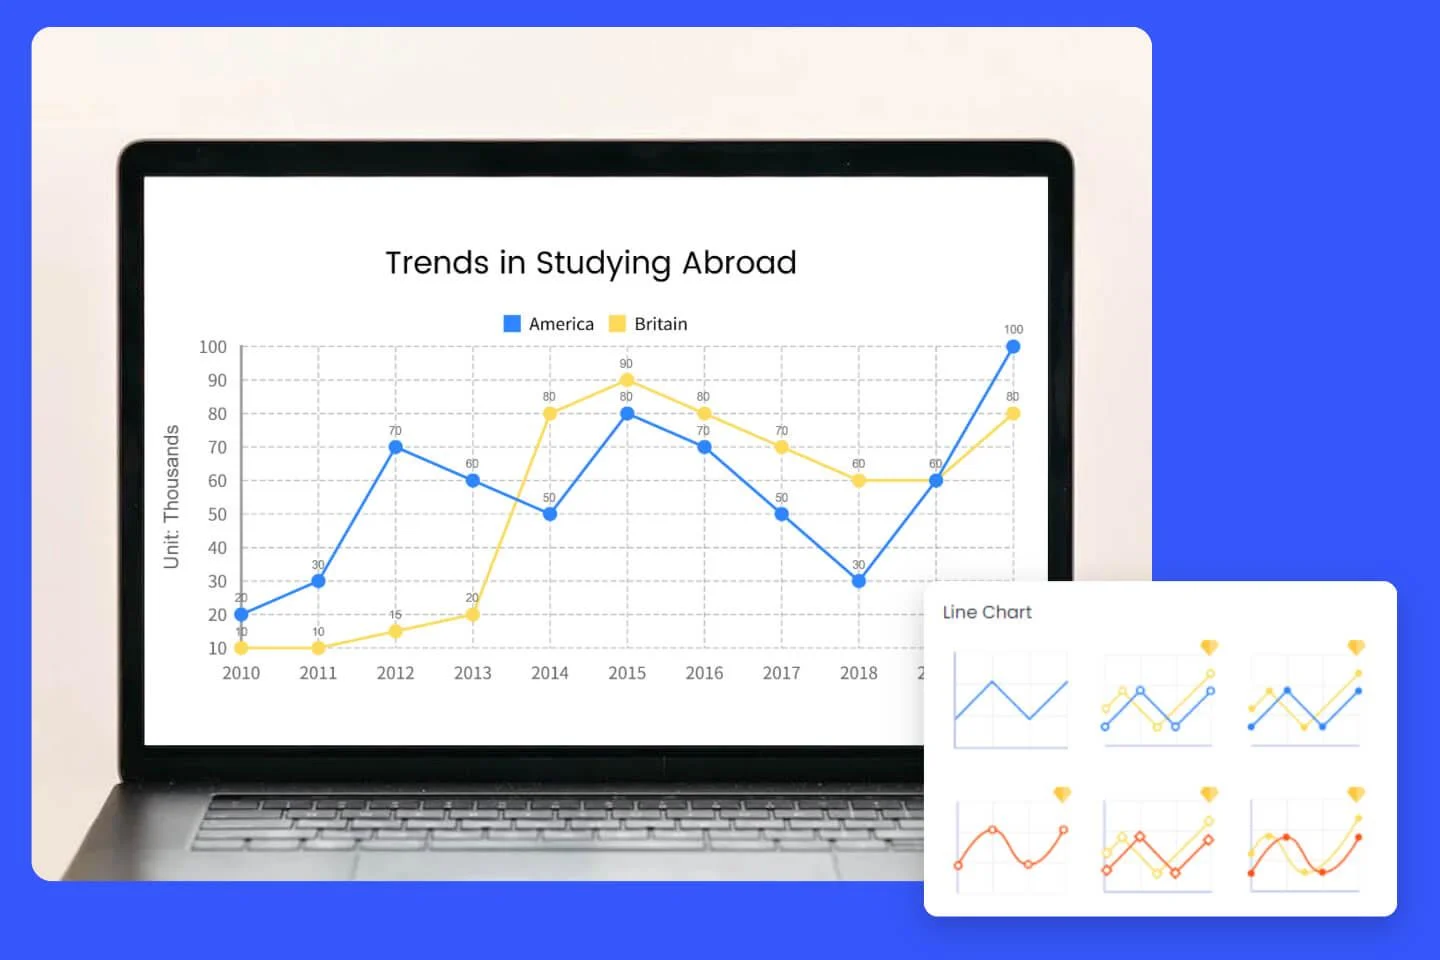
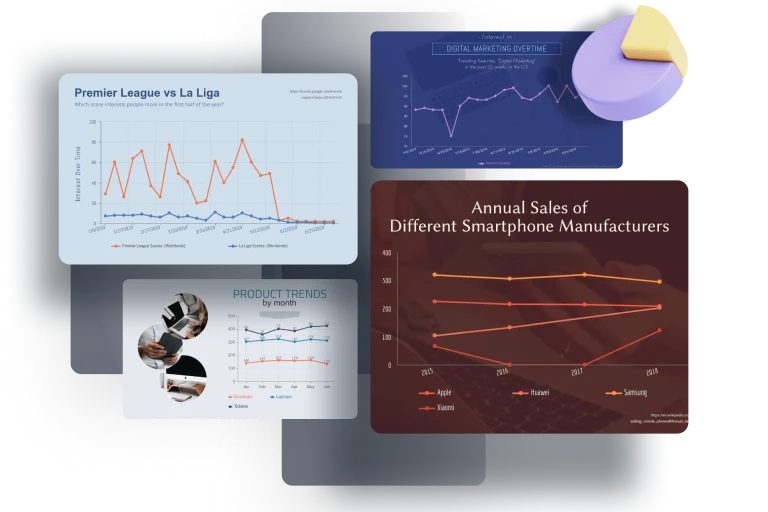
Use Graph Maker to visualize changes over time, making it easy to spot growth patterns, declines, and cyclical trends.
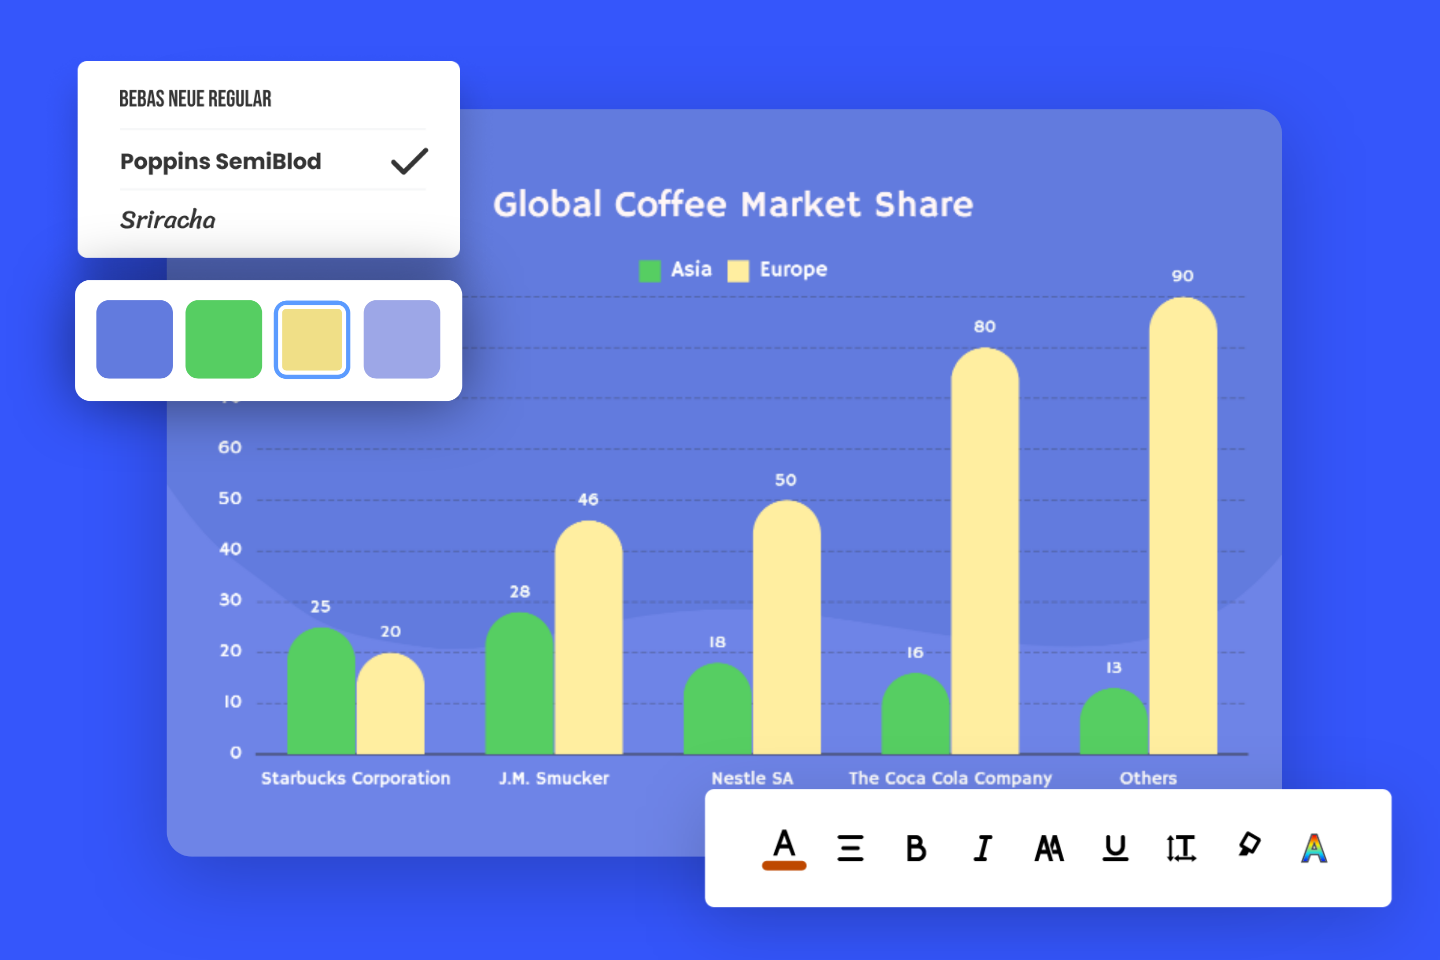
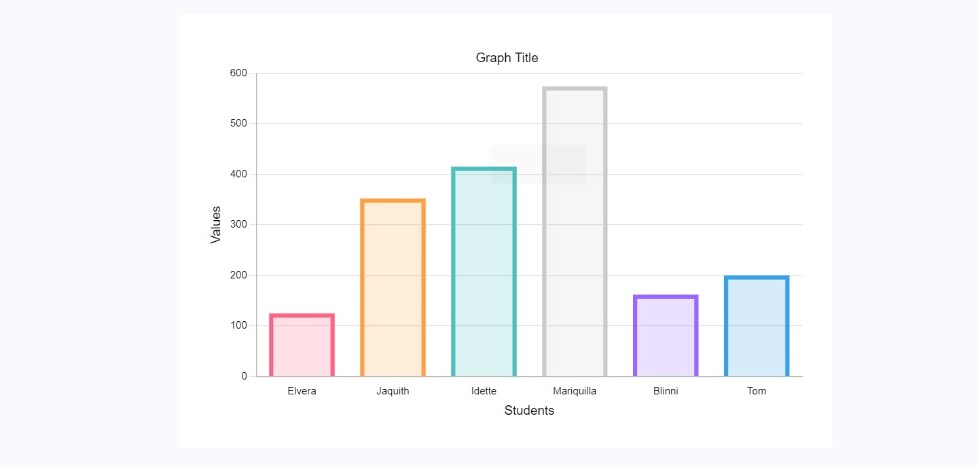
Create side-by-side comparisons of different categories with Graph Maker, highlighting differences and making data comparisons instantly clear.
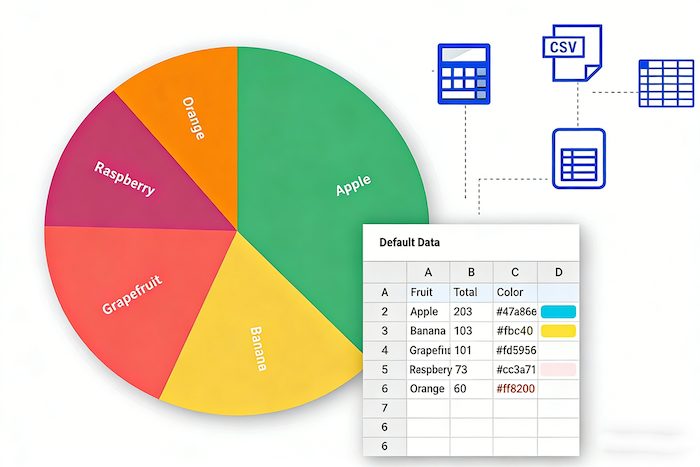
With Graph Maker, display how individual segments contribute to the whole, ideal for visualizing market share, population distribution, or proportional data.
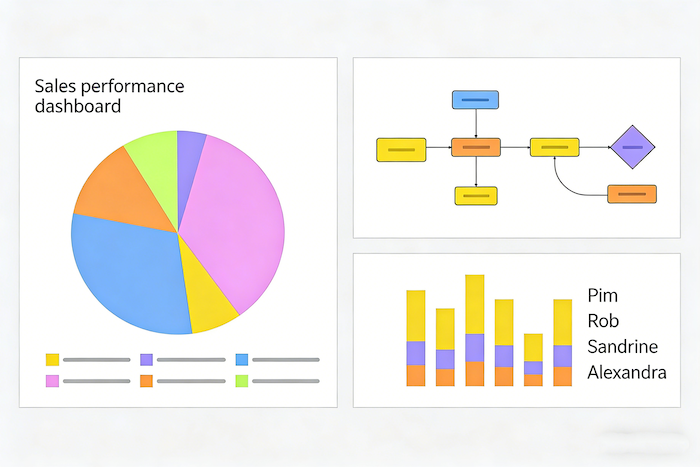
Combine multiple data dimensions in a single view using Graph Maker, allowing complex datasets to be communicated clearly and effectively for analysis and decision-making.
Graph Maker makes chart creation fast, intuitive, and accessible. In just three simple steps, you can transform your raw data into clear, professional visualizations:
Upload Excel files or paste table data directly into Graph Maker. Graph Maker prepares your data instantly, so it’s ready to turn into clear, professional visualizations—whether you’re handling large datasets or small tables.
Select the chart type that best represents your data, such as line charts, bar charts, or pie charts. With Graph Maker, you can adjust colors, fonts, labels, and layouts freely to create visuals that are both professional and brand-aligned.
With Graph Maker, you can export your charts as high-quality images or generate a shareable online link. Your visuals can be embedded in websites, reports, or presentations and are ready to use instantly.
Here you’ll find answers to the most common questions about using Graph Maker. From chart types and data import to exporting, sharing, and interactive features, these FAQs help you get the most out of the tool and create professional, insightful visualizations with ease.
Graph Maker allows you to import data from Excel, CSV, and Google Sheets. Charts can be updated in real time, ensuring your visuals always reflect the latest information.
Absolutely. Graph Maker provides interactive chart options such as hover tooltips, clickable filters, and dynamic data highlights to make your visuals more engaging and insightful.
Yes. Graph Maker generates embed codes, allowing you to insert interactive charts directly into webpages or blogs for easy and professional data presentation.
With Graph Maker, you can export charts as high-quality PNG or JPG images, or generate shareable online links for embedding in websites, reports, or presentations.
Yes, Graph Maker allows high-resolution exports, suitable for printing, reports, or presentations, ensuring your charts remain crisp and professional.
Yes, logging in is required to save, manage, and share your chart projects securely with Graph Maker.
Graph Maker offers multi-language support to accommodate users worldwide, ensuring smooth data visualization in any language environment.
Yes. Graph Maker allows you to explore and create charts by earning points through daily check-ins or completing simple tasks. This gives you a risk-free way to try its powerful features before deciding on a paid plan.
Turn your data into clear, insightful visualizations that make your content more persuasive. Whether for reports, presentations, or web content, start creating professional charts with Graph Maker now and bring your data stories to life effortlessly!
Get Started with Graph Maker Today